Banks, telecoms, hospitals, retailers and government offices all collect data. People who can clean it, analyse it and explain it clearly are needed in almost every sector.
Start with spreadsheets
Excel or Google Sheets are where most data work begins. Learn:
- Sorting, filtering and removing duplicates.
- Formulas such as SUMIFS, COUNTIFS and XLOOKUP.
- Pivot tables to summarise thousands of rows.
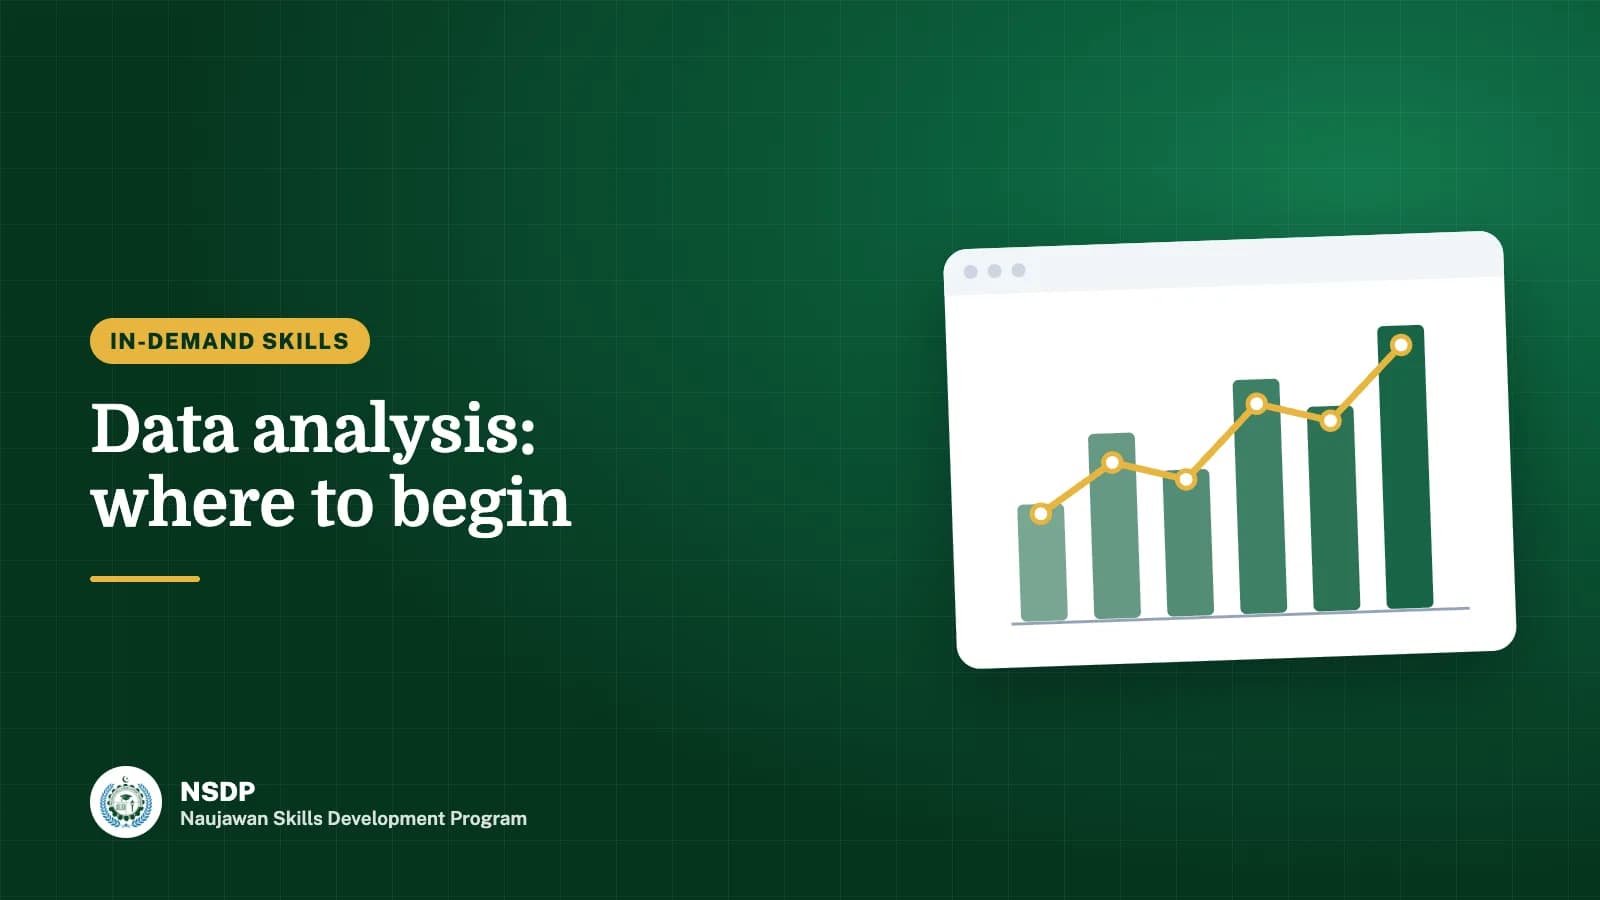
- Charts that make one point clearly.
Practice: take a month of your household or shop expenses and build a summary by category.
Learn SQL
SQL is the language used to ask questions of databases. Learn SELECT, WHERE, GROUP BY and JOIN. With these four ideas you can answer most business questions.
Add Python
Python, with the pandas library, handles data too large or messy for a spreadsheet. Learn to load a file, clean columns, group and summarise, and draw a chart.
Communicate the results
An analysis is only useful if people understand it. For every project, write three sentences: the question, what the data shows, and what you recommend.
Projects to build
- Analyse public data on a topic you care about, such as weather or cricket scores.
- Build a sales dashboard from a sample dataset.
- Compare prices of a product across months and explain the trend.
NSDP's data courses are listed on the courses page, with the monthly fee and length of each.
Questions and answers
Do I need strong maths for data analysis?
Basic maths such as percentages and averages is enough to start. You learn the statistics you need as you go.